Energy Maps Project Count
- Solar Generation 200
- Wind Generation 19
- Other Renewable Generation 12
- Natural Gas Generation 10
- Transmission Lines 23
- Transmission Substations 52
- Battery Storage 32
- Oil / Gas Wells ~5000+
- Rail and Pipeline 7
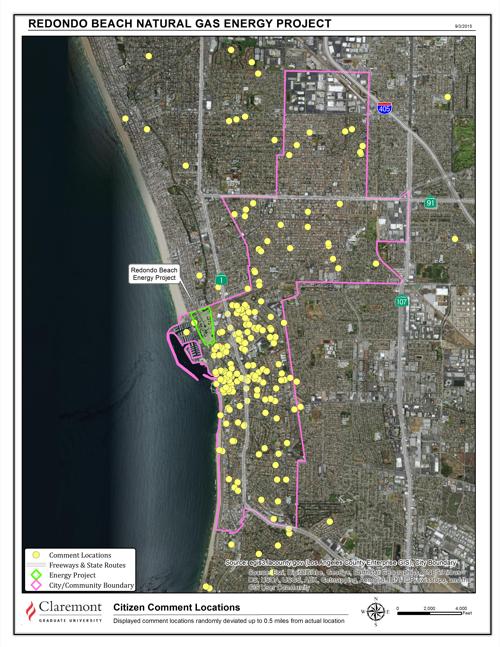
The Energy Maps project helps California residents become more involved in decisions about how energy infrastructure projects are built in their communities.
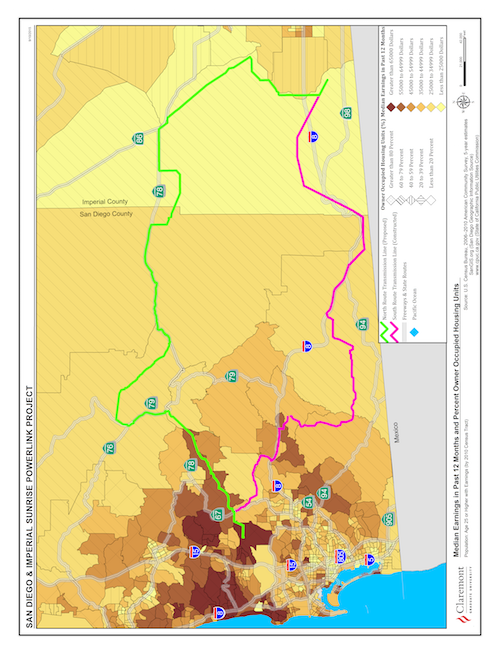
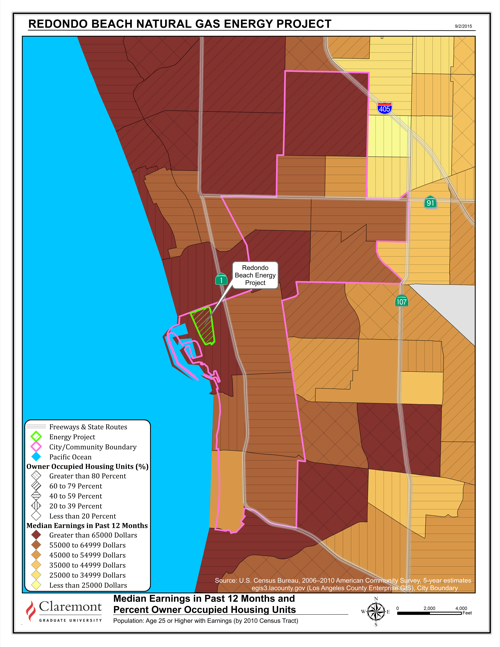
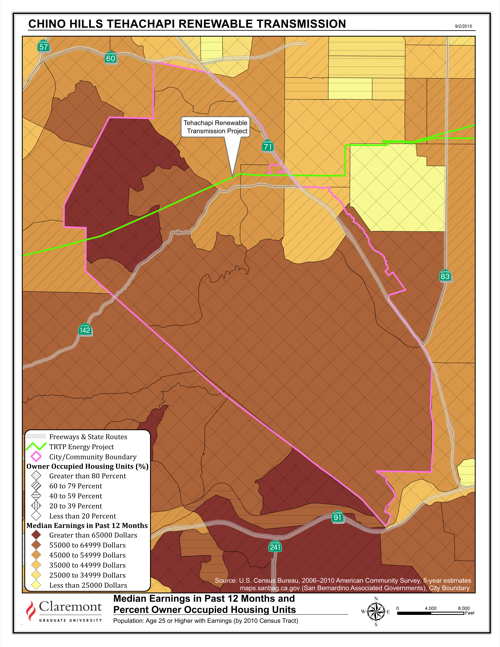
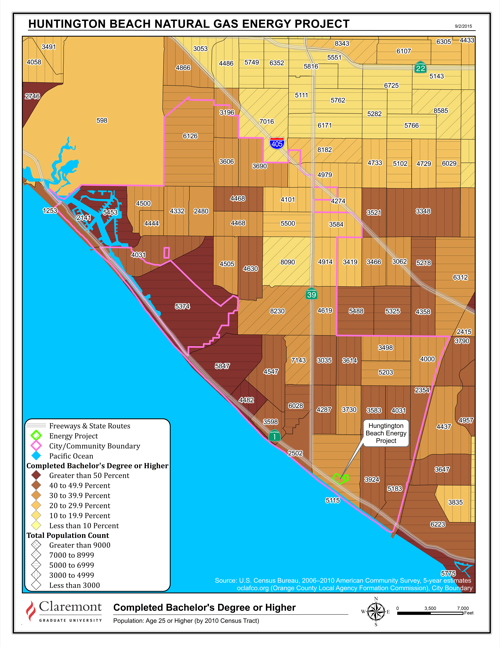
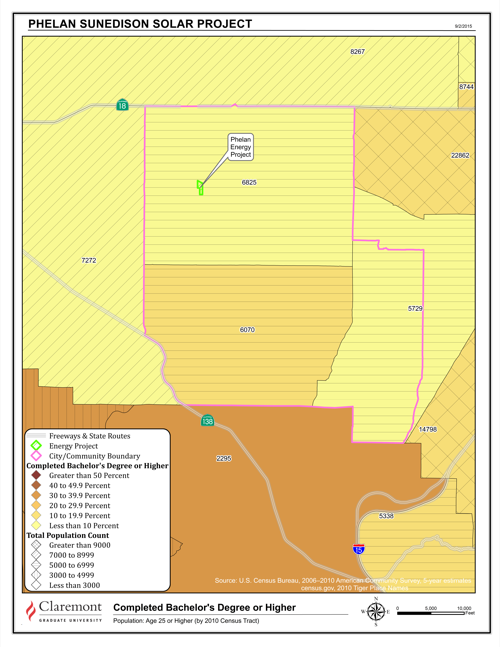
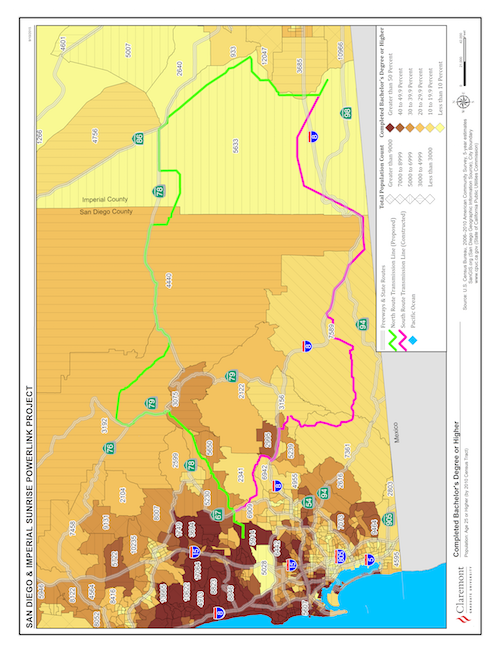
Directed by Hal Nelson, associate professor, the map depicts proposed projects such as solar and wind power plants, transmission lines, and gas pipelines, providing an early warning system for citizens and municipal governments about what’s being planned for their communities. This will help them to participate in the planning processes at an earlier stage, potentially reducing the legal gridlock and expensive delays that are straining the current system.
“Many of these projects are potentially disruptive to communities, and when they’re developed in isolation it ’s a lot harder for the communities to provide alternative ideas,” Nelson said. “We think the map has the potential to lead to better outcomes and less litigation.”
The region is experiencing a boom in energy infrastructure construction as California races to meet ambitious renewable energy goals. The queue to connect new electricity generation facilities to transmission and distribution stations contains 79 projects in Los Angeles, San Bernardino, and Riverside counties alone. Many of these new generation facilities will require new transmission lines to deliver the electricity to urban areas. In addition, if extraction of natural gas in the Monterey Shale increases, there will be a need for new natural gas pipelines, crude–by–rail infrastructures, and gas processing facilities.
These types of projects create social dilemmas: They provide much–needed economic development and reliable oil, gas, and electricity supplies, but come with tradeoffs such as environmental degradation, health and safety risks, and property value declines for communities next to them. Under the current system, communities often do not know about the projects until proponents file plans with state regulators. This “decide, announce, defend” approach can result in disastrous battles between energy suppliers and citizens during the planning process.
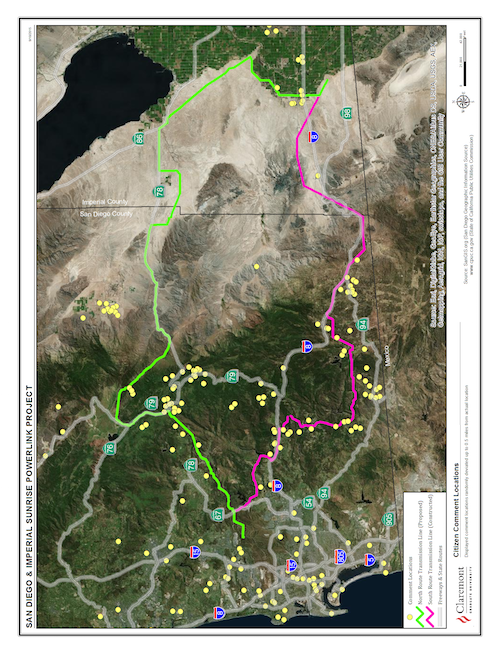
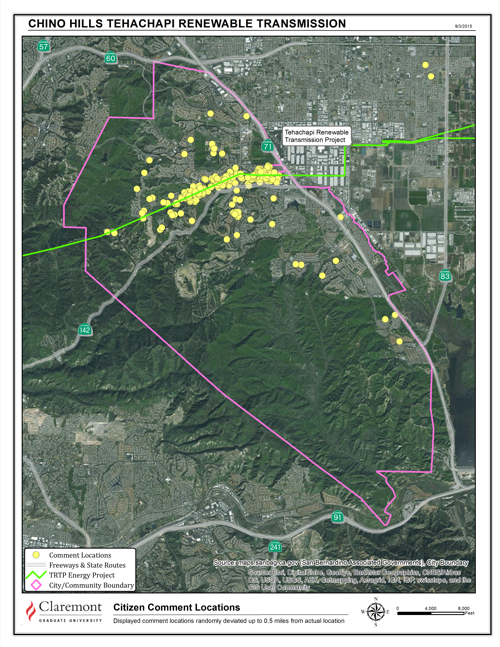
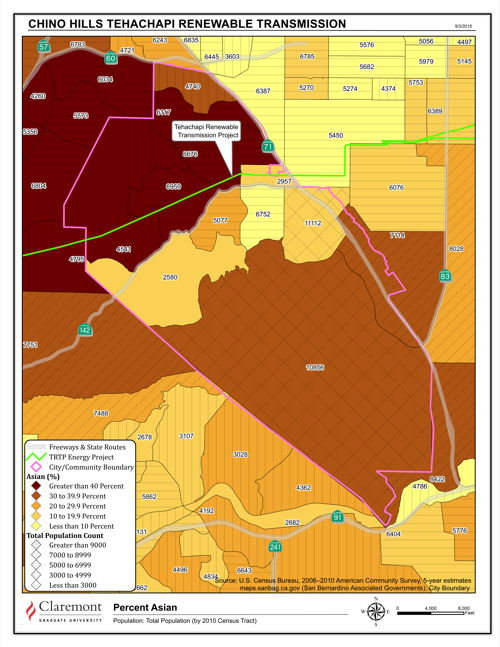
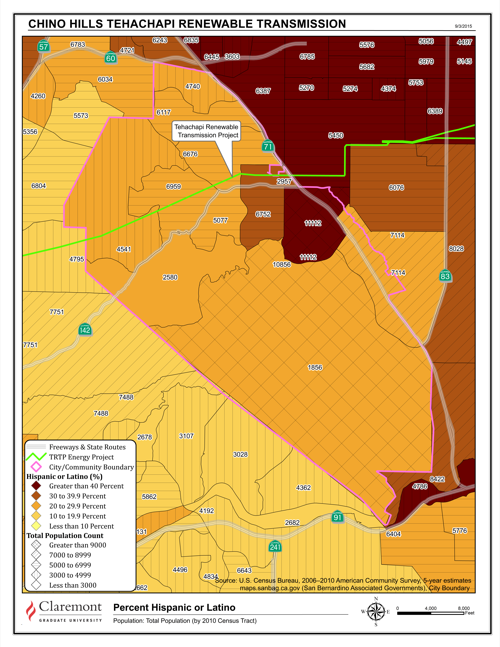
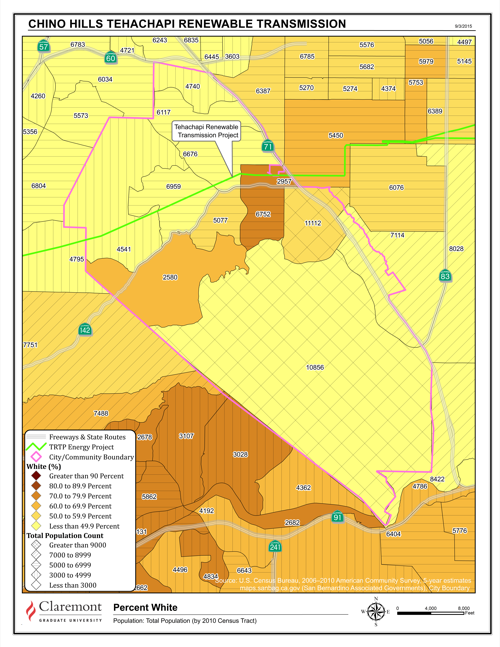
For example, a $2.1 billion, 250–mile power line project that will deliver wind energy to the Los Angeles region was delayed for more than two years while residents in Chino Hills, California, fought against a five–mile section near their homes. The city spent more than $3 million in taxpayer revenue on the battle. The local opposition group Hope for the Hills convinced the California Public Utilities Commission to halt construction and eventually ordered the segment placed underground.
“By reaching out to the project sponsors early in the design phase, communities have a better likelihood of having their concerns integrated into the project’s development,” Nelson said.
In a second element of the Energy Maps project, Dr. Nelson is leading research into the questions raised by communities about new energy infrastructure projects. Utilizing traditional data collection methods along side social network data collection and analysis, the project hopes to provide a deeper understanding of the complex factors driving new energy infrastructure conflicts in California.
“We believe that the project provides the foundation necessary to move beyond the gridlock created by contentious siting of infrastructure facilities,” states Dr. Nelson, and one that “can help ensure that California will be able to build the energy infrastructure it requires for the region’s continuing prosperity,” and beyond that to ensure “it will be located and designed in a way that is acceptable to the communities in which it is located.”
Building off previous research by Dr. Nelson on reducing conflict around energy infrastructure construction, the map and related research are funded by a two–year, $127,900 grant from the John Randolph Haynes and Dora Haynes Foundation.
Helping California residents become more involved in decisions about how energy infrastructure projects are built in their communities.
Hal T. Nelson, PhD
Project Director
Hal Nelson is an Professor in the Hatfield School of Government, Department of Public Administration, Portland State University. His research interests include quantitative methods and research design, policy analysis, the policy process, energy policy, energy efficiency, policy and program evaluation, as well as social sustainability.
Jacopo Baggio, PhD
Social Network Analyst
John Emiliano–Urata, PhD
GIS Analyst & Developer
Richard H. Ross, MA
Project Management & Web Development
Kris Wikstrom, MPPA
Project & Community Analyst

Nelson, H., *Swanson, B., *Cain, N. (2017). “Close and Connected?: The Effects of Proximity and Social Ties on Citizen Opposition to Electricity Transmission Lines.” Journal of Environment and Behavior. Vol 50, Issue 5, pp. 567 – 596 .
Nelson, H., *Cain, N., *Yang, Z. (2015). “All Politics are Spatial: Integrating an Agent–Based Decision Support Model with Spatially Explicit Landscape Data.” In Campbell, H. et al, (Eds) Rethinking Environmental Justice in Sustainable Cities. Routledge Press. pp. 168-189.

Abdollahian, M., Yang, Z., & Nelson, H. T. (2013). “Techno–Social Energy Infrastructure Siting: Sustainable Energy Modeling Programming (SEMPro).” Journal of Artificial Societies and Social Simulation, 16 (3), 1–12.
Cain, N. L., & Nelson, H. T. (2013). “What Drives Opposition to High–Voltage Transmission Lines?” Land Use Policy, 33, 204–213.
Source: California Independent Service Operator Connection Queue (Cal-ISO)
Publisher: California Independent System Operator
Source: California Energy Commission: Energy Facilities Siting / Licensing Process
Publisher: California Energy Commission
Source: Pending Renewable Energy Applications
Publisher: US Bureau of Land Management (BLM)
Source: Land Use Services: Planning, Renewable Energy
Publisher: San Bernardino County
Source: Planning, Renewable Energy
Publisher: Los Angeles County
Source: Planning, Renewable Energy
Publisher: Riverside County
Source: Planning, Renewable Energy
Publisher: Ventura County
Source: Planning, Renewable Energy
Publisher: Orange County
Source: California Energy Commission, Renewable Energy Action Team, Renewables Listing
Publisher: California Energy Commission
Source: Desert Renewable Energy Conservation Plan (DRECP)
Publisher: California Energy Commission
Source: California Independent Service Operator Connection Queue
Publisher: California Independent System Operator
Source: California Energy Commission: Energy Facilities Siting / Licensing Process
Publisher: California Energy Commission
Source: Electricity and Natural Gas Regulation in California
Publisher: California Public Utilities Commission
Source: California Independent Service Operator Connection Queue
Publisher: California Independent System Operator
Source: Electricity and Natural Gas Regulation in California
Publisher: California Public Utilities Commission
Source: Pending Renewable Energy Applications
Publisher: US Bureau of Land Management (BLM)
Disclaimer: The data referenced in this list is based on information provided by third parties. While the data is believed to be reliable, no warranty expressed or implied is made by the Energy Maps project for accuracy, completeness, reliability, or legality. Furthermore, the data reference list is subject to change, modification, and deletion at any time and without notice.
Source: Well Finder
Publisher: California Department of Conservation: Division of Oil, Gas, and Geothermal Resources
Source: Oil and Gas Drilling Permit Reports
Publisher: California Department of Conservation: Division of Oil, Gas, and Geothermal Resources
Source: BLM–related oil and gas pipeline proposals
Publisher: Bureau of Land Management (national office)
Source: California Department of Conservation
Publisher: California Department of Conservation: Division of Oil, Gas, and Geothermal Resources
Source: RBN energy market reports
Publisher: RBN Energy
Source: California Office of Spill Prevention and Response (OSPR)
Publisher: State of California
Source: OSPR Point of Contact
Publisher: Steve Hampton, California Department of Wildlife
Disclaimer: The data referenced in this list is based on information provided by third parties. While the data is believed to be reliable, no warranty expressed or implied is made by the Energy Maps project for accuracy, completeness, reliability, or legality. Furthermore, the data reference list is subject to change, modification, and deletion at any time and without notice.
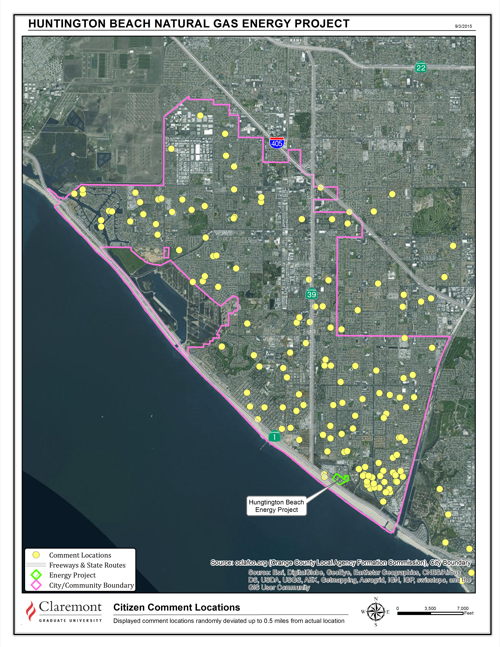
The census maps have been reduced in size and quality to protect the privacy of the individuals.
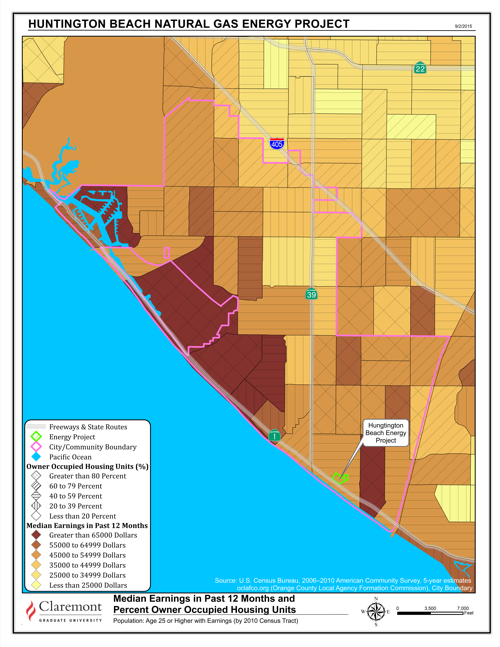
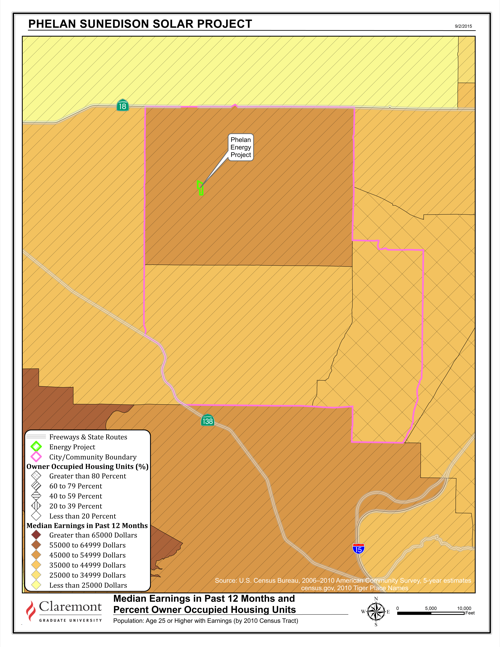
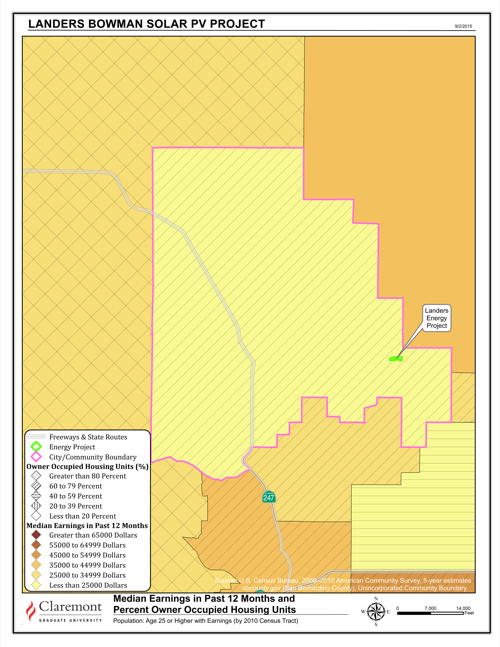
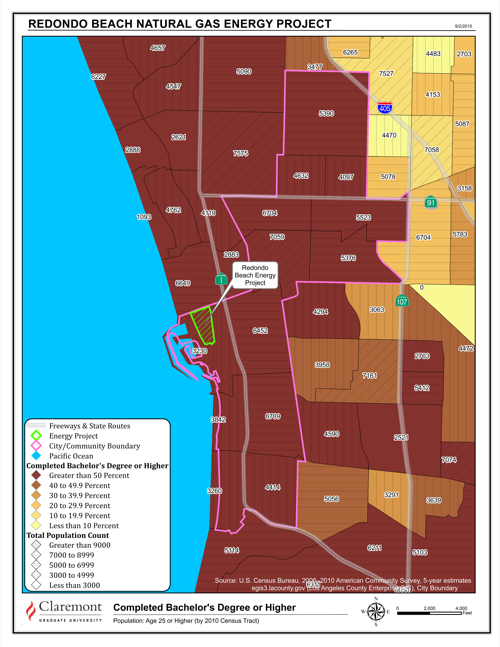
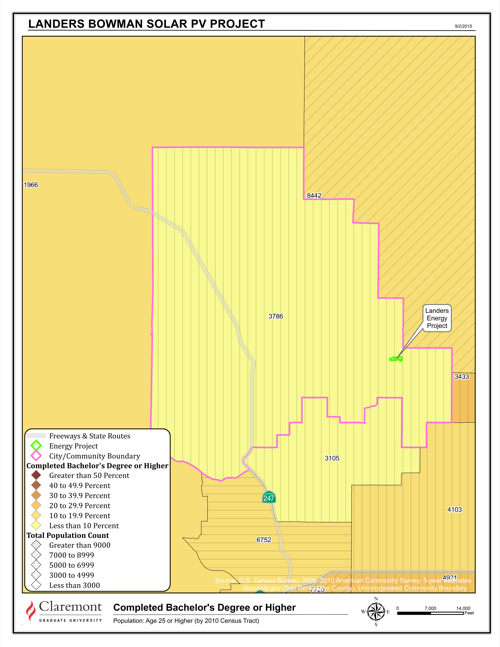
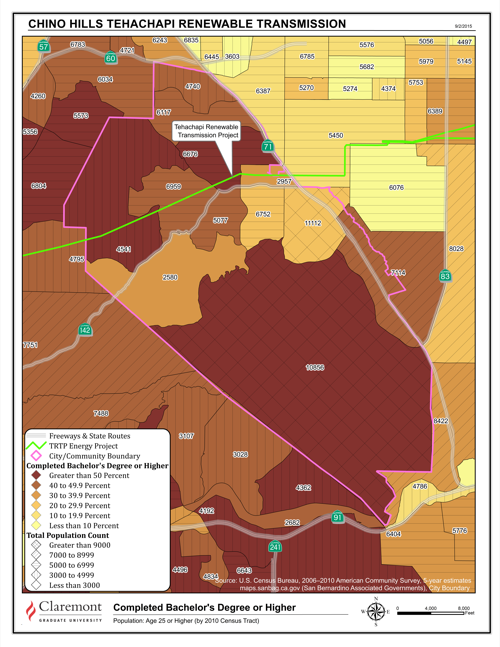
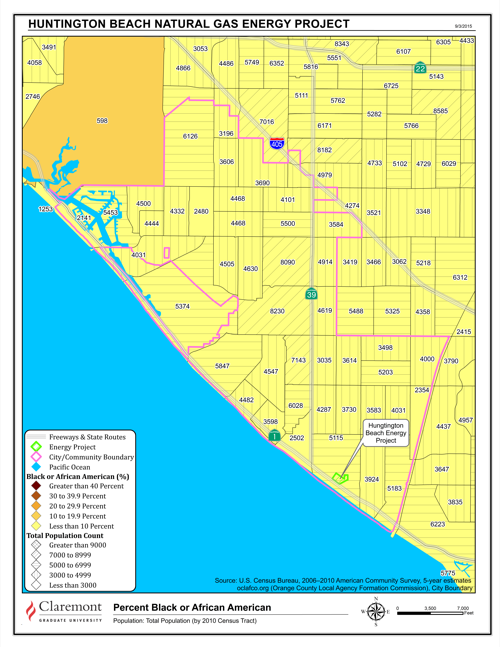
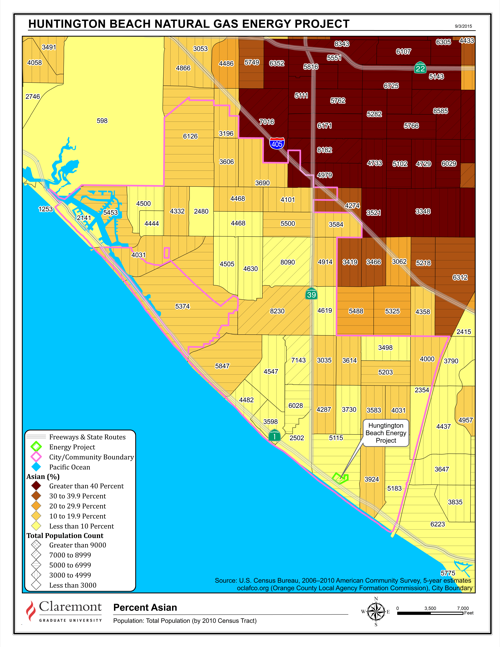
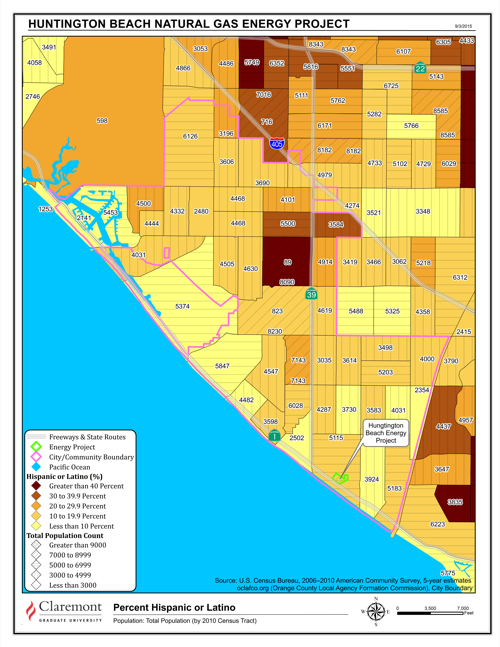
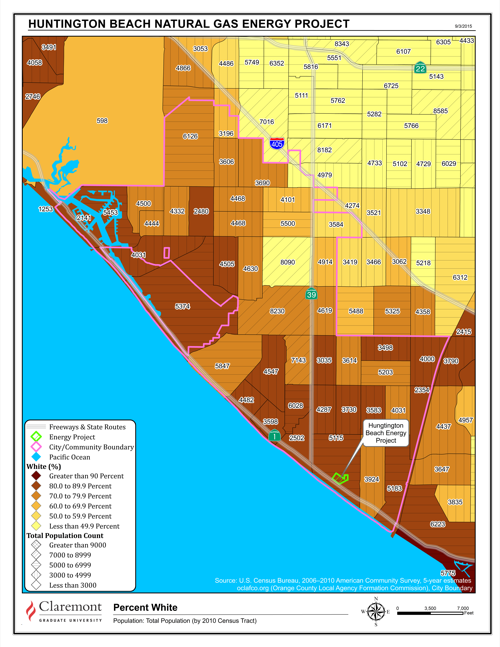
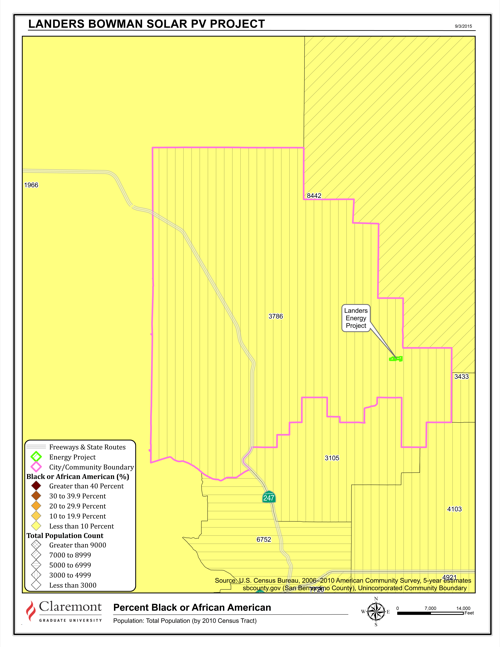
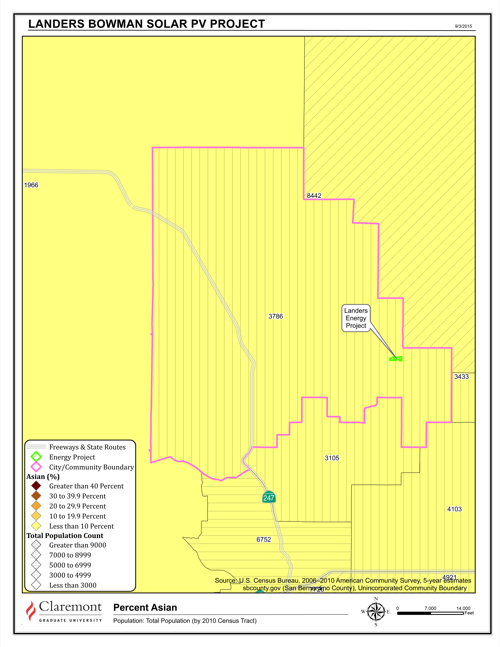
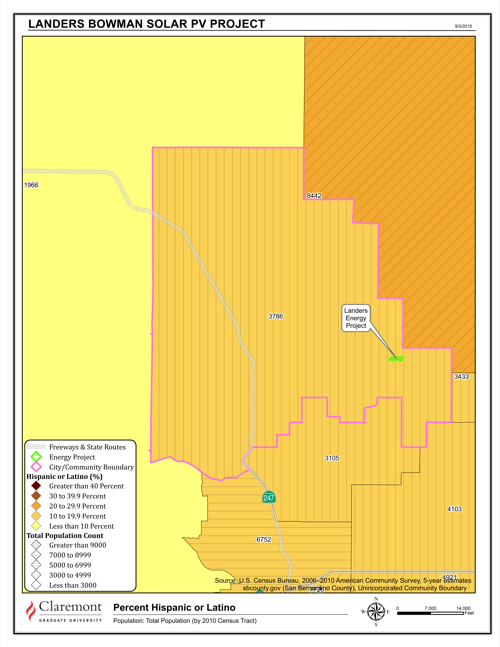
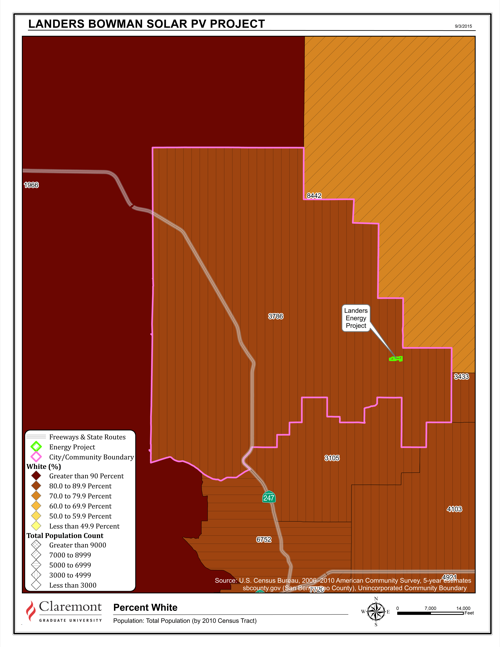
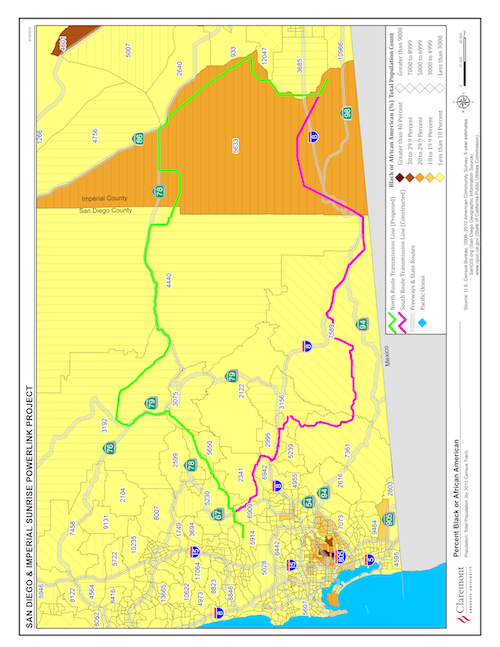
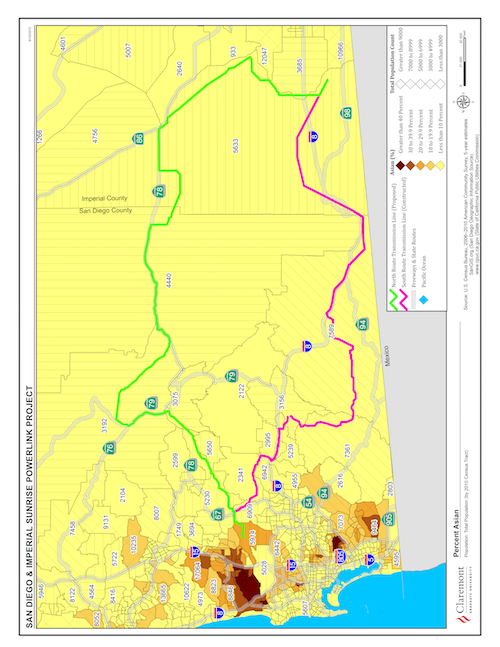
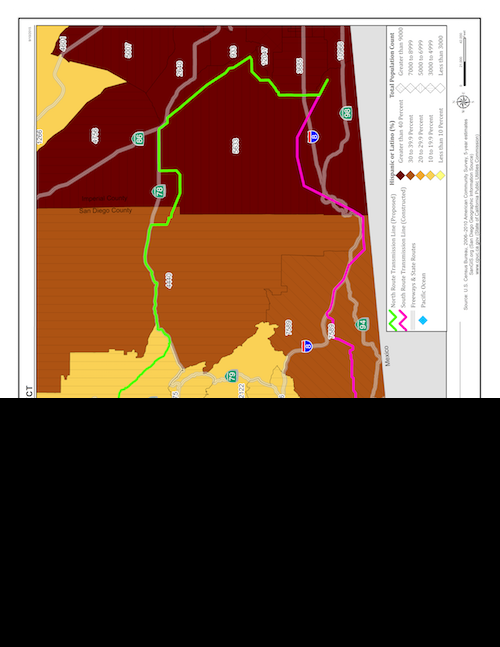
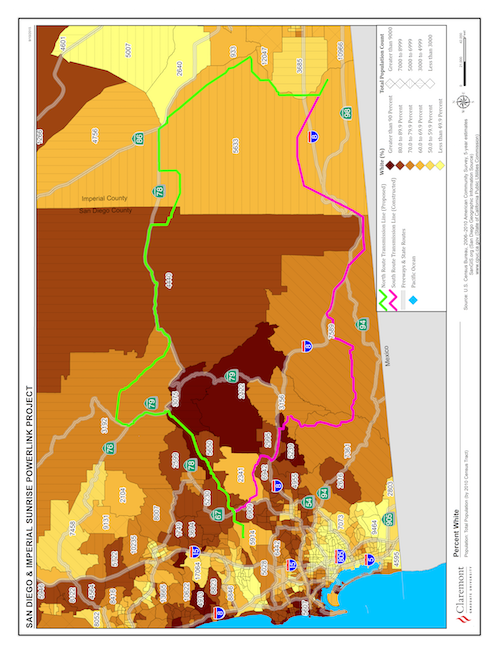
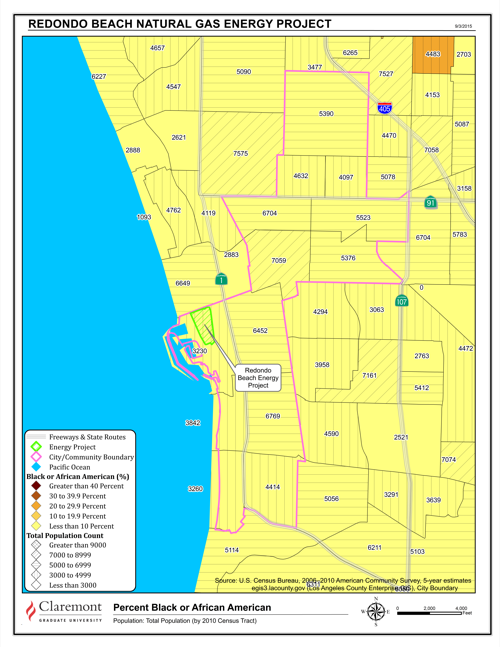
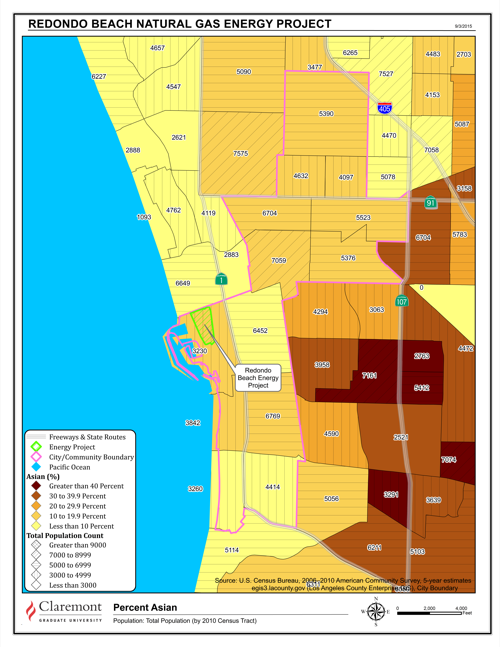
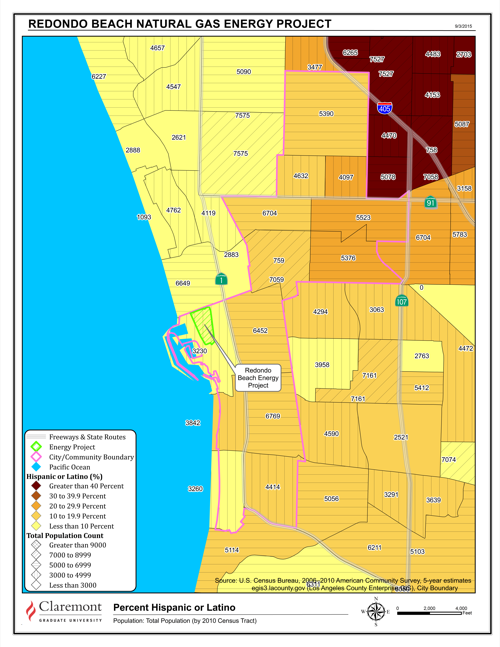
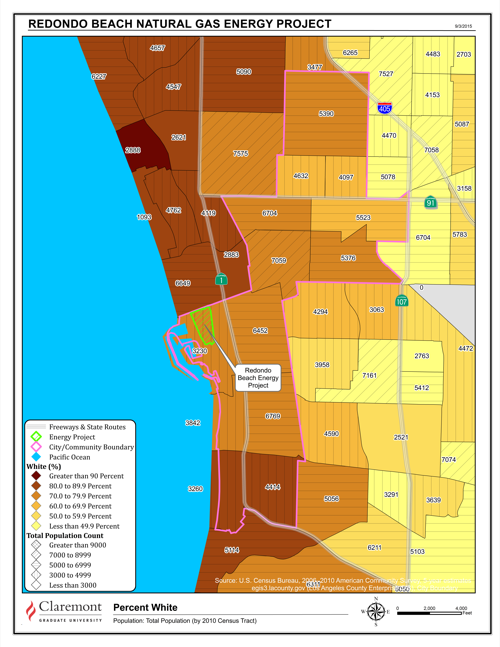
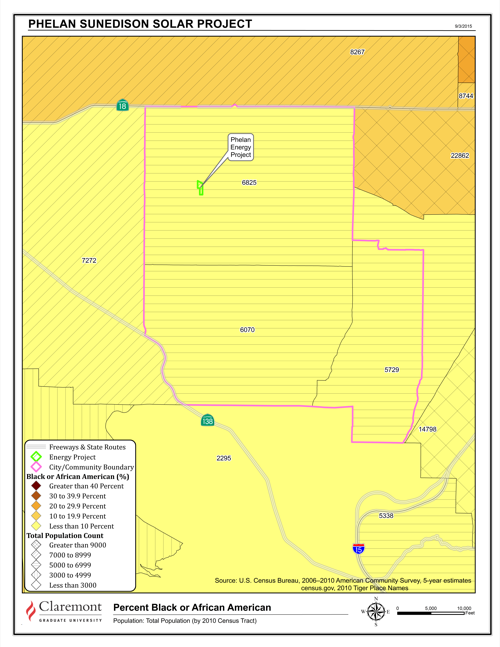
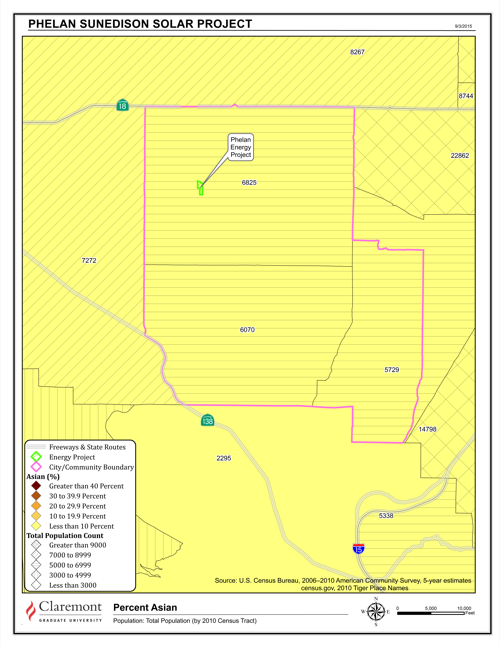
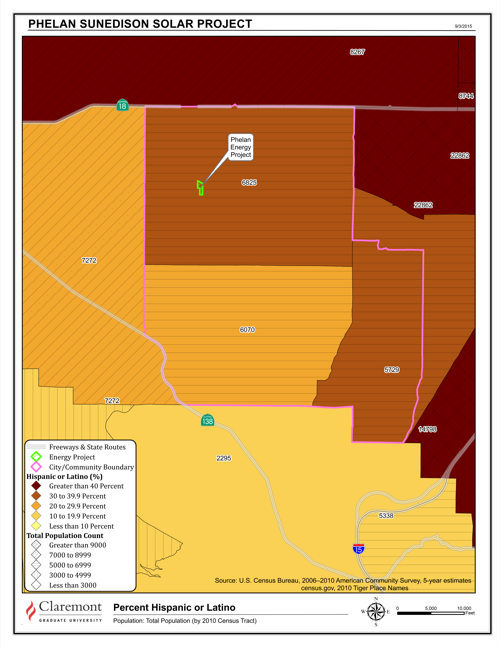
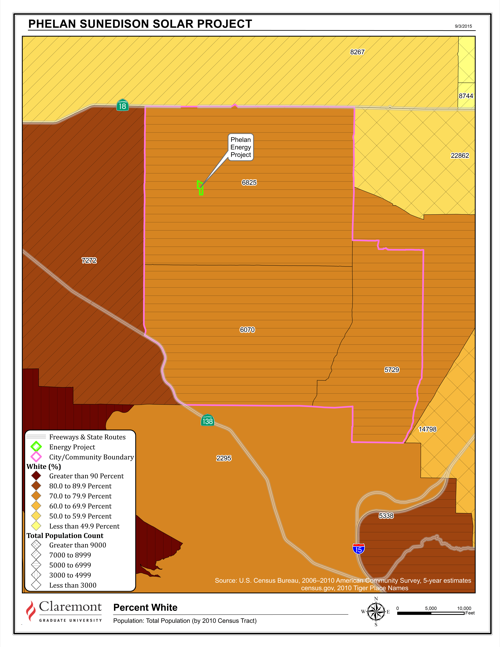
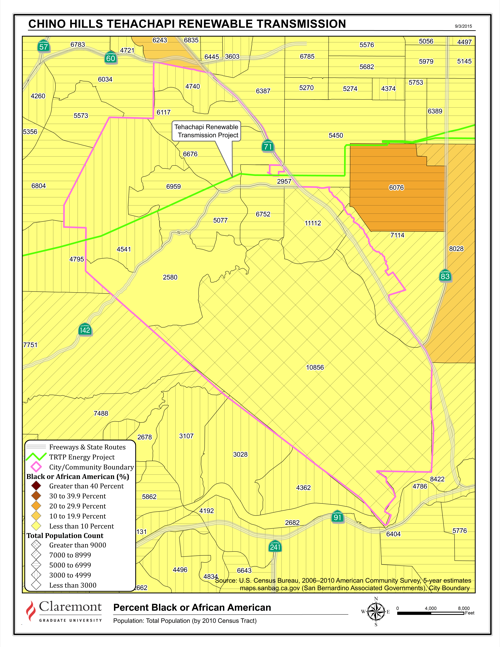
Census Source Data: 2010 Census.